Our Nonstop Retention Workshop for operators is full of examples and proof-points.
To show that mobile brands with high Nonstop Retention indices also are successful, we sample a few key proof-points here.
Free, France
Since the number of net adds is an indication both of a mobile brand’s attractiveness to new customers – as well as an indication of its attractiveness to existing customers, this graph provides proof of Free’s success in the French mobile market.
During its first operative quarter, Free gained 2,6 million customers. Even though that net intake obviously couldn’t be repeated every quarter, it’s still so that for every single quarter since launch Free has added more customers (net) than any other French operator.
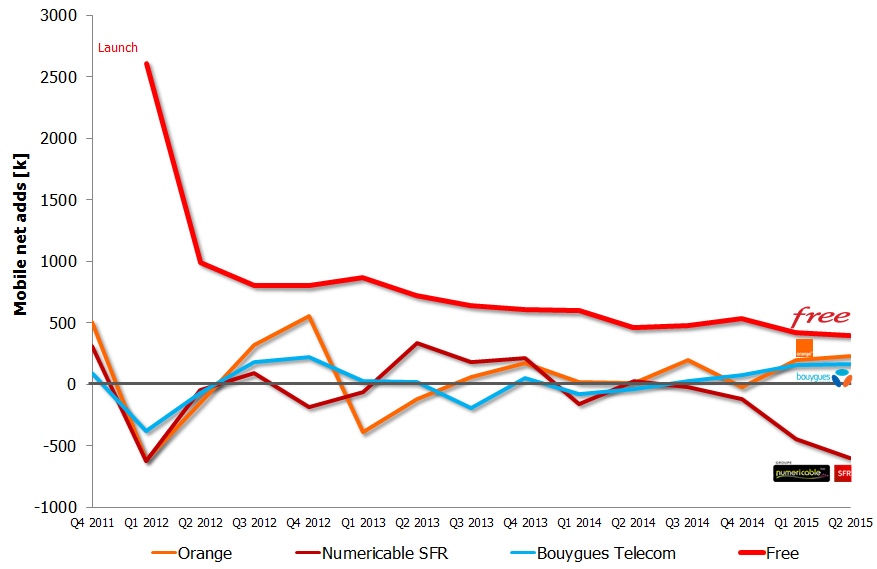
Even though the net intake has slowed down, Free still added 400 thousand new customers (net) in Q2 2015.
T-Mobile, USA
The graph below shows the postpaid net adds in the US since the start of T-Mobile’s uncarrier transformation.
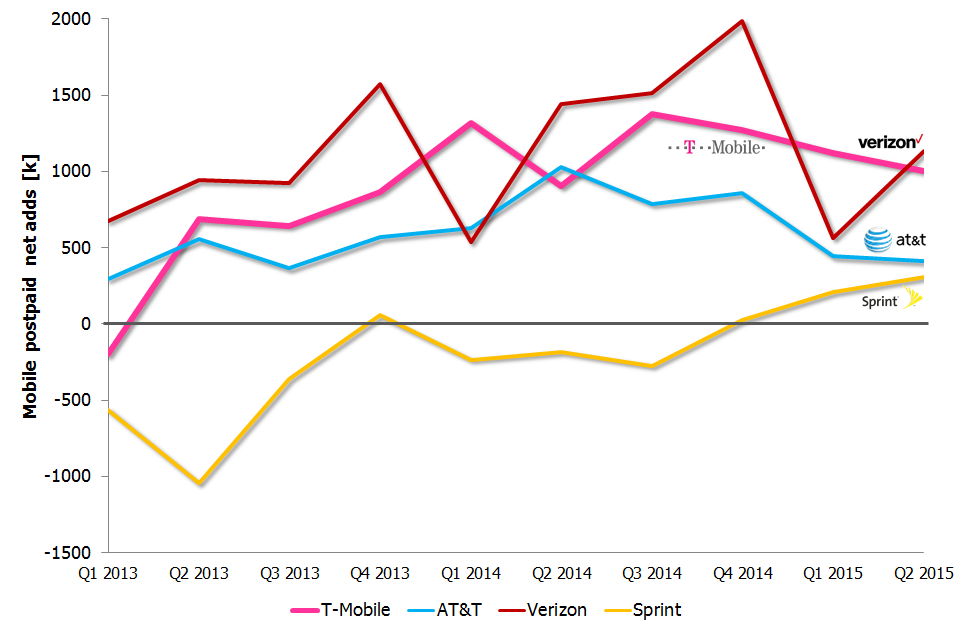
In Q1 2014 and Q1 2015, T-Mobile added more postpaid customers (net) than any other operator, but in the other quarters, T-Mobile has been behind Verizon.
There are two explanations to why even this second place is an achievement:
- Verizon has 2x the customer base compared to T-Mobile
- Verizon’s postpaid net adds are these days mainly consisting of tablets – a market segment T-Mobile isn’t that interested in
If we deduct tablets from the graph above and look at the number of postpaid phone net adds in the US, T-Mobile’s success becomes more obvious:
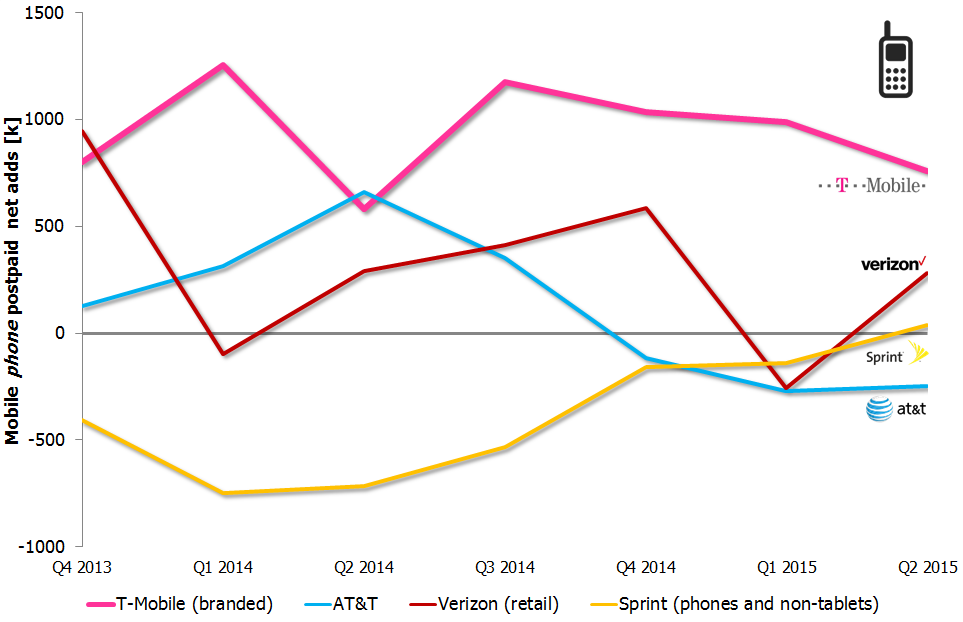
The American operators started to report tablet stats Q4 2013 and since then T-Mobile has added the highest number of postpaid phone customers in 5 of 7 quarters.
See also the T-Mobile USA specific blog post.